
Automated data gathering and visualisation enhances productivity
Custom Analytics + Software Solutions | Data Quality | Data Visualisation + Reporting Solutions
Helping Trustpower improve visibility of ISP capacity and performance through automated data collection and interactive data visualisations.
Trustpower is an electricity generation and retailing company based in Tauranga. Trustpower operates a multi-product retail business in New Zealand, including electricity, gas and telecommunications products. Their telecommunications business has grown significantly since launching Ultra-Fast Broadband (UFB) services in 2012 and now has over 100,000 customer connections.
The Challenge
Key ISP KQI and KPI data was manually collated from multiple data sources daily into a spreadsheet. From the spreadsheet, reports were generated with simplistic visualisations for various parties within Trustpower. This process was time-consuming and reliant on a single custodian. Harmonic was tasked with developing an automated solution that would reduce manual effort, increase data availability and trustworthiness, and improve visualisation and reporting quality.
The Solution
Harmonic developed a bespoke data gathering, reporting and forecasting solution that captures and stores ISP KPI and KQI metrics from an operational data source. The data is presented in a user-friendly manner via an interactive online dashboard containing high quality visualisations.
KPI data is automatically imported, processed and aggregated on a daily basis from configured data sources. The system is designed to be extendable, providing the capability to incorporate additional metrics or modify forecasted alerting thresholds as required.
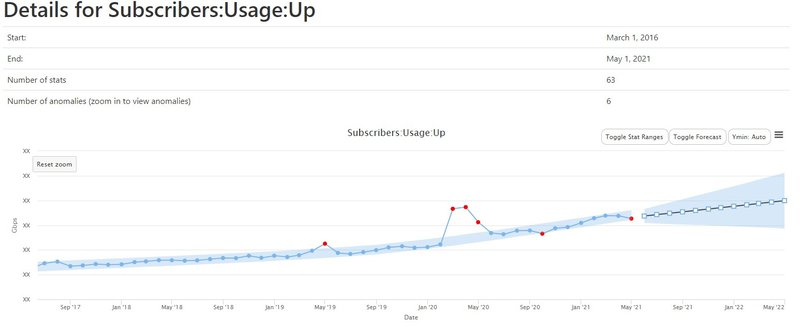
The dashboard contains a series of pre-built visualisations to allow users to rapidly assess the KQI data and download the visualisations for use in other reports. Individual KPIs, trend, projected forecast and points of interest (Data Tags) are presented to users.
Below is an (obfuscated) example of the dashboard which displays Trustpower's subscriber usage growth, outliers (in red) and a 12 month forecast of future usage.
The Result
- Improved trustworthiness of data and productivity by automating data gathering processes
- Enhanced visualisation quality enabling more effective communication of ISP performance
- Support key decision making for investment into infrastructure
The tools provided by Harmonic Analytics significantly reduced a weekly chore from several hours down to a few minutes of validation checks. The system notifies when glaringly incorrect data points are received which enables us to correct the problems at the source, mitigating the compounding effects they previously caused.
— Neil Tapp, ISP Engineer