Protection Against Geomagnetic Storms
Advanced Analytics | Data Visualisation + Reporting Solutions
Geomagnetic storms, driven by solar activity, present a significant challenge to power transmission networks worldwide. Harmonic developed an advanced predictive and visualisation tool which provides timely information to enhance decision-making and protects grid infrastructure in the face of threats from major solar storms.
The Challenge
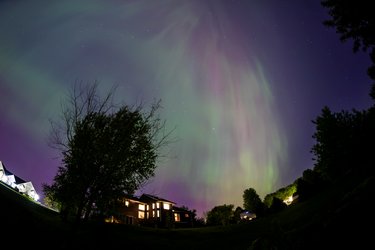
In mid-October 2024, the National Aeronautics and Space Administration (NASA), the National Oceanic and Atmospheric Administration (NOAA), and the International Solar Cycle Prediction Panel announced that the Sun has reached its solar maximum period, this corresponds to an increase in solar activity which has led to greater aurora visibility. While solar flares themselves are not dangerous to humans, extremely big and violent solar wind events, known as Coronal Mass Ejections (CME) can produce Geomagnetic Induced Currents (GIC) large enough to distort and disrupt power and telecommunications systems.
The Solution
It is important for electricity transmission providers to be aware of any potential spikes in GIC as a result of CME at all times, and take actions promptly to protect their grid assets.
Our solution provides an early warning system for the impact of solar events. Through conducting exploratory data analysis and studying information from reputable research articles, Harmonic observed that solar storms cause changes in space weather parameters and this initiates the first phase of GIC increase. Subsequently, changes in the geomagnetic field, which is caused by disturbances introduced by space weather, lead to a secondary phase of GIC increase.
A statistical model was developed based on this observation and accurately captured and explained GIC increases for the four biggest solar storms since 2017. This highly interpretable model predicts changes in GIC levels using rolling window statistics for up to 120 minutes in advance with over 70% accuracy. An interactive dashboard was built to visualise the observed and predicted GIC levels for different geographic regions across New Zealand together with the relevant space weather data. This enables proactive measures to protect grid assets and maintain power stability during solar storms.
The Result
- Visualises and predicts GIC levels across different regions in New Zealand.
- Mitigates potential impact on grid assets and power supply during GIC increases.
- Enhances decision-making, reduces downtime, and safeguards reliable electricity delivery during geomagnetic disturbances.