
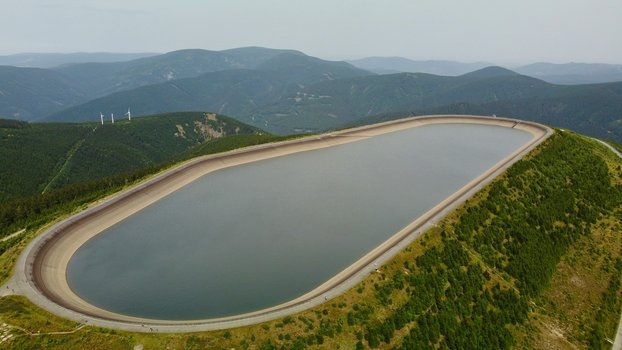
Protection Against Geomagnetic Storms
Advanced Analytics Data Visualisation + Reporting SolutionsGeomagnetic storms, driven by solar activity, present a significant challenge to power transmission networks worldwide. Harmonic developed an advanced predictive and visualisation tool which provides timely information to enhance decision-making and protects grid infrastructure in the face of threats from major solar storms.
In mid-October 2024, the National Aeronautics and Space Administration (NASA), the National Oceanic and Atmospheric Administration (NOAA), and the International Solar Cycle Prediction Panel announced …

Streamline: Forecasting the Effects of Maintenance and Renewal Policies
Advanced Analytics Custom Analytics + Software Solutions Data Visualisation + Reporting SolutionsThe Streamline solution opens the door to smarter data-driven maintenance and renewal policies for water distribution assets.
Water distribution networks across the country are approaching end-of-life, leading to increased maintenance costs and deteriorating service. Considered pipe investment and renewal schedules are hence …

Monitoring night flow measurements to detect potential leakages
Advanced Analytics Custom Analytics + Software Solutions Data Visualisation + Reporting SolutionsThe LeakSense tool facilitates the exploration of night flows and potential leakage by water industry experts, aided by specific automatic flagging of anomalous night flows.
Leakage is a huge issue for councils facing ageing water distribution infrastructure. Identifying the source of leakage and prioritising areas for maintenance can be very …
From Catchment to Consumer: Visualising a Water Network
Custom Analytics + Software Solutions Data Visualisation + Reporting SolutionsHydroBalance is an interactive visualisation tool that traces water balance from source to customer, facilitating the exploration of areas to target for leakage reduction efforts, efficiency improvements, and a better understanding of the path of water through the network.
The water industry faces a range of challenges in its goal of supplying clean drinking water to customers. This includes being able to supply sufficient …
Empowering Reliability: Harnessing Data Science for New Zealand's Electricity Network
Advanced Analytics Data QualityThe SAIDI, or System Average Interruption Duration Index is a key metric for network reliability performance in the electricity industry. It corresponds to the sum of all customer interruption duration divided by the total number of customers served, offering a comprehensive gauge of service reliability.
Over recent years, Top Energy has experienced higher than expected unplanned SAIDI and reported SAIDI has increased each year. Increasingly challenging weather conditions, which are …

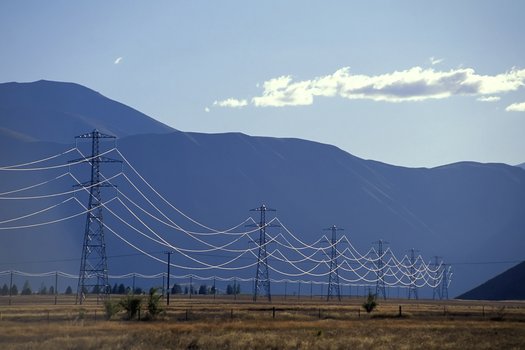
Simplifying the UK's Move to Renewables with Alarm Grouping
Custom Analytics + Software SolutionsTraditionally, electricity distribution networks were designed for one-way power flow, from distributors to consumers. This design aligns with the original concept of electricity transmission. However, as prosumers become more prevalent, and technical solutions like grids and micro-grids emerge, it's only natural for the electricity network to evolve. This transformation involves a shift from Distribution Network Operators (DNO) to Distribution System Operators (DSO).
This transition holds immense potential, especially in optimising the utilisation of renewable electricity resources. It empowers better control and comprehension of supply and demand dynamics, …

Helping New Zealand’s birds find the safest path through wind turbines
Advanced AnalyticsUsing advanced data analysis techniques to develop an avifauna collision risk model to assist Boffa Miskell with the assessment of ecological impacts of wind farms on birds, and, specifically, to enable robust testing of layout and design scenarios that will minimise collision risk to birds.
Boffa Miskell engaged Harmonic Analytics to replace a simple collision risk model that had been in use since 2004, with a new model that responds …

Identifying successful incentives to optimise staff retention
Data Visualisation + Reporting SolutionsHelping a multinational firm predict the likelihood of staff leaving and determine what may encourage them to stay.
Experiencing increasing demand for services in a tightening labour market, a multinational firm asked Harmonic Analytics to develop a quantifiably robust method to predict the …

Casting a light on Aotearoa’s darkest assets
Custom Analytics + Software Solutions Data Quality Data Visualisation + Reporting SolutionsImproving the transparency of Three Waters asset data quality across New Zealand.
Data is essential for assessing the condition of Three Waters (wastewater, drinking water and stormwater) pipe networks, planning renewals and scheduling maintenance. Traditionally, pipe asset …

Illuminating Fibre Prospects
Advanced Analytics Custom Analytics + Software SolutionsProviding Northpower Fibre (Northpower) with data driven insights to identify potential customers using predictive probabilities generated by a propensity model.
Northpower engaged Harmonic Analytics to provide analytical insights to help determine whether a residential entity may be a potential customer. These insights would help Northpower …