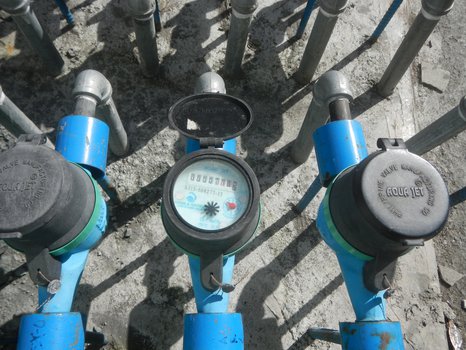
Cleaning millions of meter reading data points to improve reporting capability.
Custom Analytics + Software Solutions Data QualityHelping Tauranga City Council automate a manual data cleansing process to free up six weeks per year of manual effort and improve both the quality and accessibility of critical business data.
Every year, Tauranga City Council is required to report its water consumption and other metrics to Water NZ. These metrics must be accurate, and therefore …

Automated data gathering and visualisation enhances productivity
Custom Analytics + Software Solutions Data Quality Data Visualisation + Reporting SolutionsHelping Trustpower improve visibility of ISP capacity and performance through automated data collection and interactive data visualisations.
Key ISP KQI and KPI data was manually collated from multiple data sources daily into a spreadsheet. From the spreadsheet, reports were generated with simplistic …
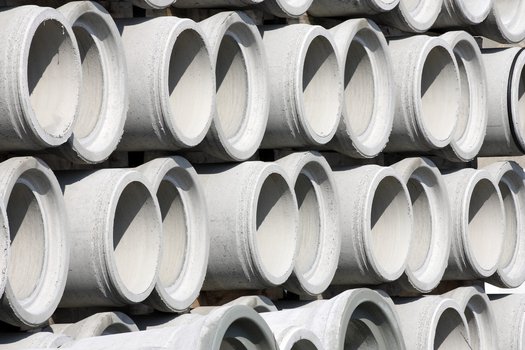
Statistical modelling to inform strategies for managing aging pipe networks
Advanced Analytics Custom Analytics + Software Solutions Data Visualisation + Reporting SolutionsHelping water utilities understand the factors that contribute to deterioration of asbestos cement pipes and make informed decisions around proactive maintenance and replacement.
It is estimated that there are approximately 40,000 km of Asbestos Cement (AC) pipes still in service across water supply networks in Australia. Many of …

Complaints dashboard puts the customer first
Data Visualisation + Reporting SolutionsCreating an interactive, elegant dashboard can be a daunting task, especially when it is publicly available. Harmonic has applied their skills and expertise to help the Banking Ombudsman Scheme achieve their vision of a dashboard that would step up transparency about banking customer complaints.
A core aspect of BOS’s work is understanding customers’ complaints about their banks. BOS wanted to take a closer look at complaints across specific banks …

Investigation and planning before a data migration makes moving data easy
Data QualityHarmonic performed a data quality assessment on the Ministry for Primary Industry’s Climate Change Information System to aid its upgrade and migration.
The Emissions Trading Scheme (ETS) is used by the New Zealand government to meet domestic and international climate change targets. The forestry component of the …
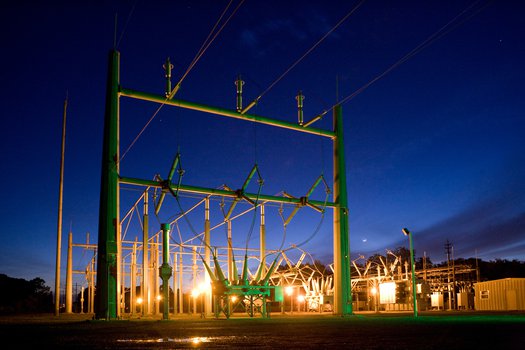
Floods of alarming insights
Advanced Analytics Custom Analytics + Software Solutions Data Visualisation + Reporting SolutionsA major Energy Networks company in Australia was concerned about the rapidly growing number of alarms on their distribution network.
Within the control room, controllers were swarmed with alarms every second, needlessly elevating stress and lowering morale. While the notification and monitoring of alarms is …

Enduring relationship helps deliver water services to 1.5 million people daily
Advanced Analytics Data Quality Data Science Team Development Data Visualisation + Reporting SolutionsHarmonic builds enduring relationships with our clients to provide ongoing value and expertise. Our lengthy professional relationship with Watercare has allowed us to contribute to several aspects of their business, including; performing data quality assessments and exploratory data analyses, creating custom algorithms and analytical measures; developing and productionising forecasting projects, and; building their in-house data science team.
Watercare supplies around 365 million litres of water to Auckland every day. Water is drawn from 23 sources, treated and supplied to homes and businesses …

Machine Learning improves cargo revenue optimisation for leading international airline
Advanced AnalyticsHarmonic developed an international-flight cargo space estimation tool to maximise revenue in collaboration with a leading international airline.
The leading airline had wasted capacity due to high no-show rates for several international routes. As cargo customers would not be charged for unused space …
Data Visualisation puts New Zealanders well-being front and centre
Data Visualisation + Reporting SolutionsHarmonic worked with The Treasury to present quantifiable measures of well-being.
As part of the LSF, The Treasury sought to visualise and compare several indicators of well-being, and present well-being measures across three indicators; ‘Our country’, …

Understanding New Zealand’s native plant capacity will get us to one billion trees
Custom Analytics + Software Solutions Data Visualisation + Reporting SolutionsWhen the New Zealand government announced that one billion trees would be planted by 2028, the nursery sector did not have an accurate measure of how many trees could be produced to meet this need each year.
Meeting the New Zealand government's one billion trees goal by 2028 requires putting trees in the ground; roughly two hundred and seventy thousand trees every …