
Protection Against Geomagnetic Storms
Advanced Analytics Data Visualisation + Reporting SolutionsGeomagnetic storms, driven by solar activity, present a significant challenge to power transmission networks worldwide. Harmonic developed an advanced predictive and visualisation tool which provides timely information to enhance decision-making and protects grid infrastructure in the face of threats from major solar storms.
In mid-October 2024, the National Aeronautics and Space Administration (NASA), the National Oceanic and Atmospheric Administration (NOAA), and the International Solar Cycle Prediction Panel announced …

Streamline: Forecasting the Effects of Maintenance and Renewal Policies
Advanced Analytics Custom Analytics + Software Solutions Data Visualisation + Reporting SolutionsThe Streamline solution opens the door to smarter data-driven maintenance and renewal policies for water distribution assets.
Water distribution networks across the country are approaching end-of-life, leading to increased maintenance costs and deteriorating service. Considered pipe investment and renewal schedules are hence …

Monitoring night flow measurements to detect potential leakages
Advanced Analytics Custom Analytics + Software Solutions Data Visualisation + Reporting SolutionsThe LeakSense tool facilitates the exploration of night flows and potential leakage by water industry experts, aided by specific automatic flagging of anomalous night flows.
Leakage is a huge issue for councils facing ageing water distribution infrastructure. Identifying the source of leakage and prioritising areas for maintenance can be very …
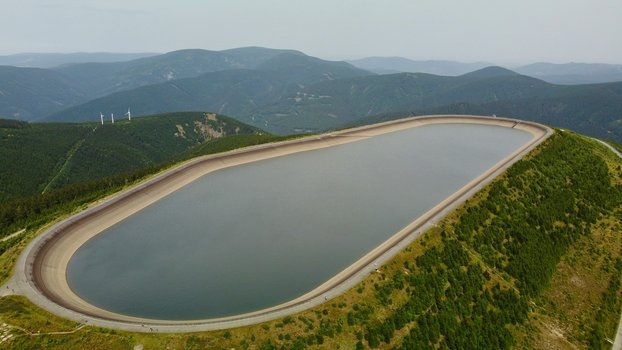
From Catchment to Consumer: Visualising a Water Network
Custom Analytics + Software Solutions Data Visualisation + Reporting SolutionsHydroBalance is an interactive visualisation tool that traces water balance from source to customer, facilitating the exploration of areas to target for leakage reduction efforts, efficiency improvements, and a better understanding of the path of water through the network.
The water industry faces a range of challenges in its goal of supplying clean drinking water to customers. This includes being able to supply sufficient …

Identifying successful incentives to optimise staff retention
Data Visualisation + Reporting SolutionsHelping a multinational firm predict the likelihood of staff leaving and determine what may encourage them to stay.
Experiencing increasing demand for services in a tightening labour market, a multinational firm asked Harmonic Analytics to develop a quantifiably robust method to predict the …

Casting a light on Aotearoa’s darkest assets
Custom Analytics + Software Solutions Data Quality Data Visualisation + Reporting SolutionsImproving the transparency of Three Waters asset data quality across New Zealand.
Data is essential for assessing the condition of Three Waters (wastewater, drinking water and stormwater) pipe networks, planning renewals and scheduling maintenance. Traditionally, pipe asset …

Automated data gathering and visualisation enhances productivity
Custom Analytics + Software Solutions Data Quality Data Visualisation + Reporting SolutionsHelping Trustpower improve visibility of ISP capacity and performance through automated data collection and interactive data visualisations.
Key ISP KQI and KPI data was manually collated from multiple data sources daily into a spreadsheet. From the spreadsheet, reports were generated with simplistic …
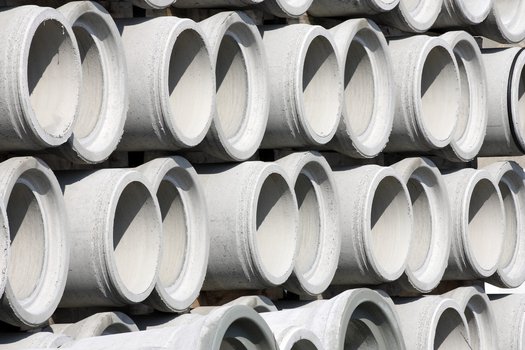
Statistical modelling to inform strategies for managing aging pipe networks
Advanced Analytics Custom Analytics + Software Solutions Data Visualisation + Reporting SolutionsHelping water utilities understand the factors that contribute to deterioration of asbestos cement pipes and make informed decisions around proactive maintenance and replacement.
It is estimated that there are approximately 40,000 km of Asbestos Cement (AC) pipes still in service across water supply networks in Australia. Many of …

Complaints dashboard puts the customer first
Data Visualisation + Reporting SolutionsCreating an interactive, elegant dashboard can be a daunting task, especially when it is publicly available. Harmonic has applied their skills and expertise to help the Banking Ombudsman Scheme achieve their vision of a dashboard that would step up transparency about banking customer complaints.
A core aspect of BOS’s work is understanding customers’ complaints about their banks. BOS wanted to take a closer look at complaints across specific banks …

Floods of alarming insights
Advanced Analytics Custom Analytics + Software Solutions Data Visualisation + Reporting SolutionsA major Energy Networks company in Australia was concerned about the rapidly growing number of alarms on their distribution network.
Within the control room, controllers were swarmed with alarms every second, needlessly elevating stress and lowering morale. While the notification and monitoring of alarms is …