
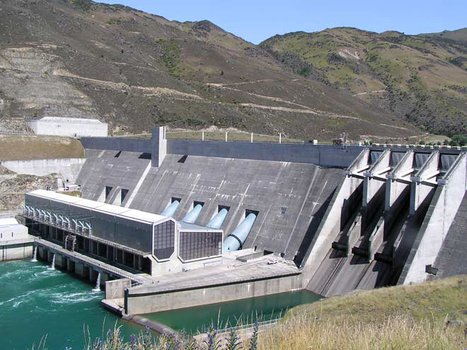
Enduring relationship helps deliver water services to 1.5 million people daily
Advanced Analytics Data Quality Data Science Team Development Data Visualisation + Reporting SolutionsHarmonic builds enduring relationships with our clients to provide ongoing value and expertise. Our lengthy professional relationship with Watercare has allowed us to contribute to several aspects of their business, including; performing data quality assessments and exploratory data analyses, creating custom algorithms and analytical measures; developing and productionising forecasting projects, and; building their in-house data science team.
Watercare supplies around 365 million litres of water to Auckland every day. Water is drawn from 23 sources, treated and supplied to homes and businesses …

Data Visualisation puts New Zealanders well-being front and centre
Data Visualisation + Reporting SolutionsHarmonic worked with The Treasury to present quantifiable measures of well-being.
As part of the LSF, The Treasury sought to visualise and compare several indicators of well-being, and present well-being measures across three indicators; ‘Our country’, …

Understanding New Zealand’s native plant capacity will get us to one billion trees
Custom Analytics + Software Solutions Data Visualisation + Reporting SolutionsWhen the New Zealand government announced that one billion trees would be planted by 2028, the nursery sector did not have an accurate measure of how many trees could be produced to meet this need each year.
Meeting the New Zealand government's one billion trees goal by 2028 requires putting trees in the ground; roughly two hundred and seventy thousand trees every …

Forecasting Apprenticeship Numbers with Confidence
Advanced Analytics Custom Analytics + Software Solutions Data Visualisation + Reporting SolutionsApprentice numbers vary year to year and are often strongly influenced by economic factors, the construction industry job market and the demand for housing in New Zealand. An accurate projection is required to minimise the financial impact from over or under forecasting apprentice numbers and advanced analytical modelling is the key to gaining confidence when forecasting these numbers.
BCITO wanted to gain confidence in forecasting demand for apprentices over the long term so as to proactively position itself to meet the demand for …

Crash Analytics to help reduce the National Road Toll
Advanced Analytics Custom Analytics + Software Solutions Data Visualisation + Reporting SolutionsLeveraging data with machine learning and analytics can help make a real difference in understanding and addressing various global or local social problems, including the New Zealand road toll.
A large Crown Entity wanted to gain insights into the root causes behind high death and serious incidents (DSI) rates occurring in a specific region …

Visualising trends and patterns across millions of alarm logs every month
Advanced Analytics Custom Analytics + Software Solutions Data Visualisation + Reporting SolutionsControl Rooms are constantly inundated with thousands of network alarms. With overwhelming amounts of alarm data, determining root cause and priority amongst the noise is a challenge. Data visualisation, machine learning and advanced analytics can help address these challenges.
To improve alarm management and resolution, a large electrical infrastructure company needed a quick and visual way to identify, analyse and prioritise trends and patterns …
Data Visualisation unlocks 360° views of Process Safety Performance
Custom Analytics + Software Solutions Data Visualisation + Reporting SolutionsHelping Contact Energy gain visibility of process safety performance and quickly understand trends, outliers, and patterns in their process safety data by harnessing the power of data visualisation.
Contact Energy wanted a 360° view of their process safety performance across sites and plants that could be used by executives and operational staff. It …